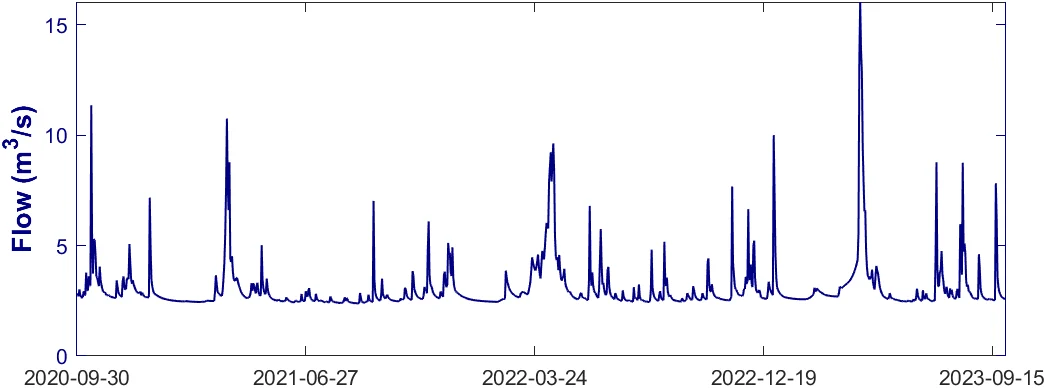
A hydrograph is a type of chart that is widely used by hydrologists to represent how streamflow (shown on the vertical axis) changes over time (shown on the horizontal axis). Peaks in a hydrograph represent an increase in flow and typically signal the response of a stream (and its associated watershed) to rainfall or snowmelt, while dips in a hydrograph signal drier periods.
